
Century-scale Climate Cycles:
In addition to multi-millennial glacial and interglacial cycles, there are shorter cold-warm cycles that occur on approximately 200 to 1,500 year time scales. The mechanisms that cause these cycles are primarily driven by changes in the sun along with several corresponding changes such as océan circulation patterns. The intensity of the sun’s activity changes over time. The sun’s specific activity is most often referred to as solar flares or hot spots. The Medieval Warm Period (900 to 1300 AD) and the Little Ice Age (1450 to 1900 AD) are examples of warm and cold phases in these types of cycles. The intensity of the sun is directly related to what is defined as solar flares or hot spots.
The Medieval Warm Period was a time of warm climate in the North Atlantic region and other Asia areas including China lasting from about c. 950 to c. 1250.
The Little Ice Age is a period between about 1300 and 1870 during which Europe and North America were subjected to colder winters than during the 20th century.
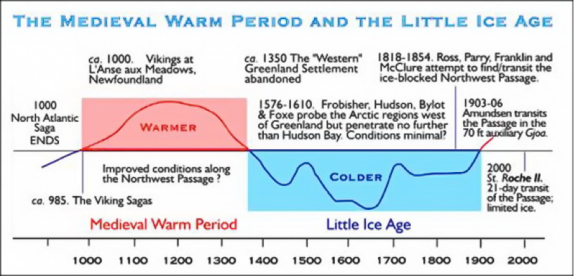
Figure 6. The Medieval Warm Period and The Little Ice Age dates and duration is one aspect of the Century-scale Climate Cycles.
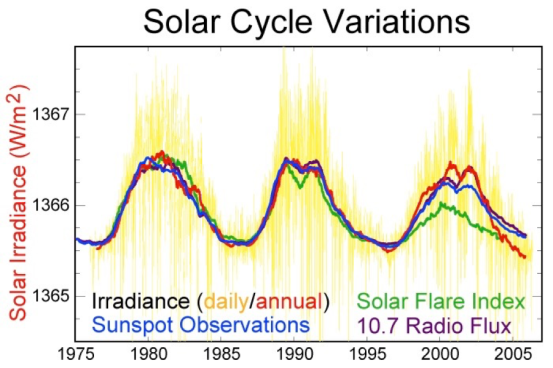
Solar Cycle Variations:
The solar cycle or solar magnetic activity cycle is the nearly periodic 11-year change in the Sun’s activity (including changes in the levels of solar radiation and ejection of solar material) and appearance (changes in the number and size of sunspots, flares, and other manifestations)
An earthly attribute should also be remembered and that is water takes a longer period of time to either cool or warm. Therefore, to the degree to which the ocean warms or cools from the sun’s radiation, it occurs over longer intervals than the periods for the earth’s landmass. This is confusing to many who talk about planet temperature averages. They fail to consider the lag in ocean warming or cooling as compared to the planet’s landmass. So, when Global Average Temperatures are computed the lag factor is often not considered. This being the case, the measured average is rarely correct. The real average is either hotter or cooler depending on where our planet is in its Natural Variability cycle. Complicated? Not really, in this cycle, the planet’s average temperatures just vary depending on the level of Solar Activity and that variable is skewed by the lag factor of the water’s temperature.
Landmass and Water Heat Capacity: Water has a higher heat capacity than land. So it takes more heat to raise the temperature of one gram of water by one degree than it does to raise the temperature of land. Furthermore, oceans retain heat longer and therefore they cool slower than the earth’s landmass.
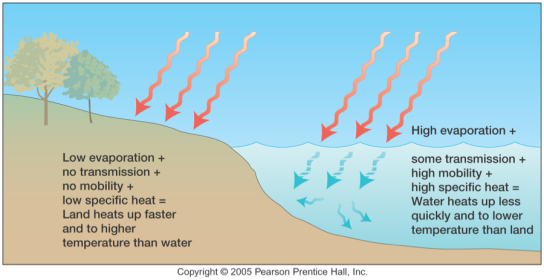
Figure 8. The opaqueness of water is less than that of land. Therefore, radiation is able to penetrate deeper into water and distributes the energy more evenly. Solar radiation only reaches a few centimeters into land while, depending on the clarity, solar radiation can reach several meters into water. The result is that a greater volume of water is heated at a slower rate. The smaller volume of land however attains higher temperatures.
Interannual to Decadal Cycles:
There is one more topic about the sun we should review and that is the sun’s solar cycle variations and their effect on earth’s climate. The sun transcends the unique time categories and therefore we will review some additional sun comments separately from the Millennial Climate Cycles, Century-scale Climate Cycles, and Interannual to Decadal Cycles.
For more than 100 years, scientists have wondered if cycles on the Sun and changes of the energy received at Earth affect global climate. It is now known the cycles do have effect on the global climate. The solar cycle is the rise and fall of the number of sunspots on the Sun.
Solar activity is correlated to the number of sunspots on the Sun. As the number of sunspots goes up, solar activity occurrences go up. Energy output from the Sun also changes as the sunspot count on the Sun changes. It is greatest when there are the most sunspots and lowest when there are the least sunspots. With satellite measurements, scientists have been able to confirm that the total solar energy varies 0.1% over one 11-year sunspot cycle. This variation of 0.1% means a global troposphere temperature difference of 0.5C to 1.0C. These facts definitely have to be taken into account when dealing with climate predictions. An example of when the solar cycle affected Earth’s climate is the Maunder Minimum. This was when almost no sunspots were seen from about 1645 to 1715. During this time, Europe and parts of North America were struck by spells of really cold weather. This was a change to the expected regional climate. The 11-year sunspot cycle is one-half of the 22-year solar magnetic cycle.
Every 11 years sunspots fade away. “This is called solar minimum,” says Dean Pesnell of NASA’s Goddard Space Flight Center in Greenbelt, MD. The sun is now heading toward solar minimum. Sunspot counts were high in 2014, and mow sliding toward a low point by 2019-2020. It’s cooling now.
Direct observations over the past four centuries show that the number of sunspots observed on the Sun’s surface varies periodically, going through successive maxima and minima. Following sunspot cycle 23, the Sun went into a prolonged minimum characterized by a very weak polar magnetic field and an unusually large number of days without sunspots4. Sunspots are strongly magnetized regions generated by a dynamo mechanism6 that recreates the solar polar field mediated through plasma flows.
Here we report results from kinematic dynamo simulations, which demonstrate that a fast meridional flow in the first half of a cycle, followed by a slower flow in the second half, reproduces both characteristics of the minimum of sunspot cycle 23. Our model predicts that, in general, very deep minima are associated with weak polar fields. Sunspots govern the solar radiative energy and radio flux, and, in conjunction with the polar field, modulate the solar wind, the heliospheric open flux and, consequently, the cosmic ray flux at Earth.
400 Years of Sunspot Observation: In 1645, the sun became nearly spotless. During the 70-year period that followed, known as the Maunder Minimum, sunspots appeared only rarely on the surface of the Sun. Now, after a peak in magnetic activity that drove the appearance of a multitude of sunspots during the 1950s and 60s, the Sun again appears to be headed toward such a minimum.
Yet it’s not always a bad thing when history repeats itself — it means that we can study the past to predict the future.
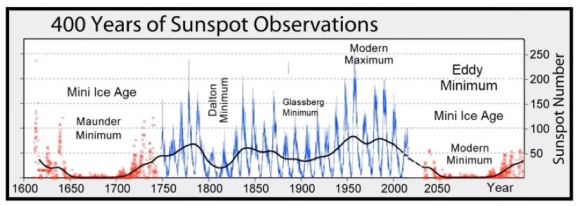
Figure 9: This graph clearly shows the long-term variations in sunspot activity from the Min Ice Age, Maunder Minimum, Dalton Minimum, Gleissberg Minimum, Modern Maximum, and the upcoming Eddy Minimum and Mini Ice Age or Modern Minimum
Ok, now that we understand this variability, Chapter Three will include a summary of Natural Variability.

Thanks for the research and post.
LikeLike